According to the Bureau of Labor Statistics (BLS), there are almost 230,000 physical therapists (PTs) throughout the United States.1 Whether you’re learning how to become a physical therapist or are a practicing PT, you may wonder what the best states for physical therapists are. Depending on your situation and future goals, the criteria of what makes a state the best for a physical therapist may vary.
Below, we review various metrics to help you see which states are ideal for physical therapists. We highlight how much physical therapists make on average in each state and list the cost of living index and projected growth for each state.
Using these criteria, we’ve developed a methodology to rank the best states for physical therapists.
Table of Contents:
- What Do Physical Therapists Do?
- Key Findings
- Top 10 States for Physical Therapists
- Average Physical Therapist Salary by State
- Projected Job Growth for Physical Therapists by State
- Top-Paying Industries for Physical Therapists
- What Physical Therapists Treat
- Begin Your Physical Therapy Education Today
- Methodology
What Do Physical Therapists Do?
The primary job of a physical therapist is to help patients with injuries manage their pain and regain the range of motion in the injured area. Whether the injured area gets back to 100% or not, physical therapists help patients improve their quality of life.
Physical therapists work in various settings, including:
- Hospitals
- Schools
- Outpatient clinics
- Inpatient rehabilitation facilities
- Sports and fitness facilities
- Private practices
As a physical therapist, you’re there to listen to the patients, to address their concerns and help diagnose issues by monitoring their movements. By understanding the patient’s goals, you can help provide them with exercises and stretching to help get them back to the activities they enjoy.
Key Findings
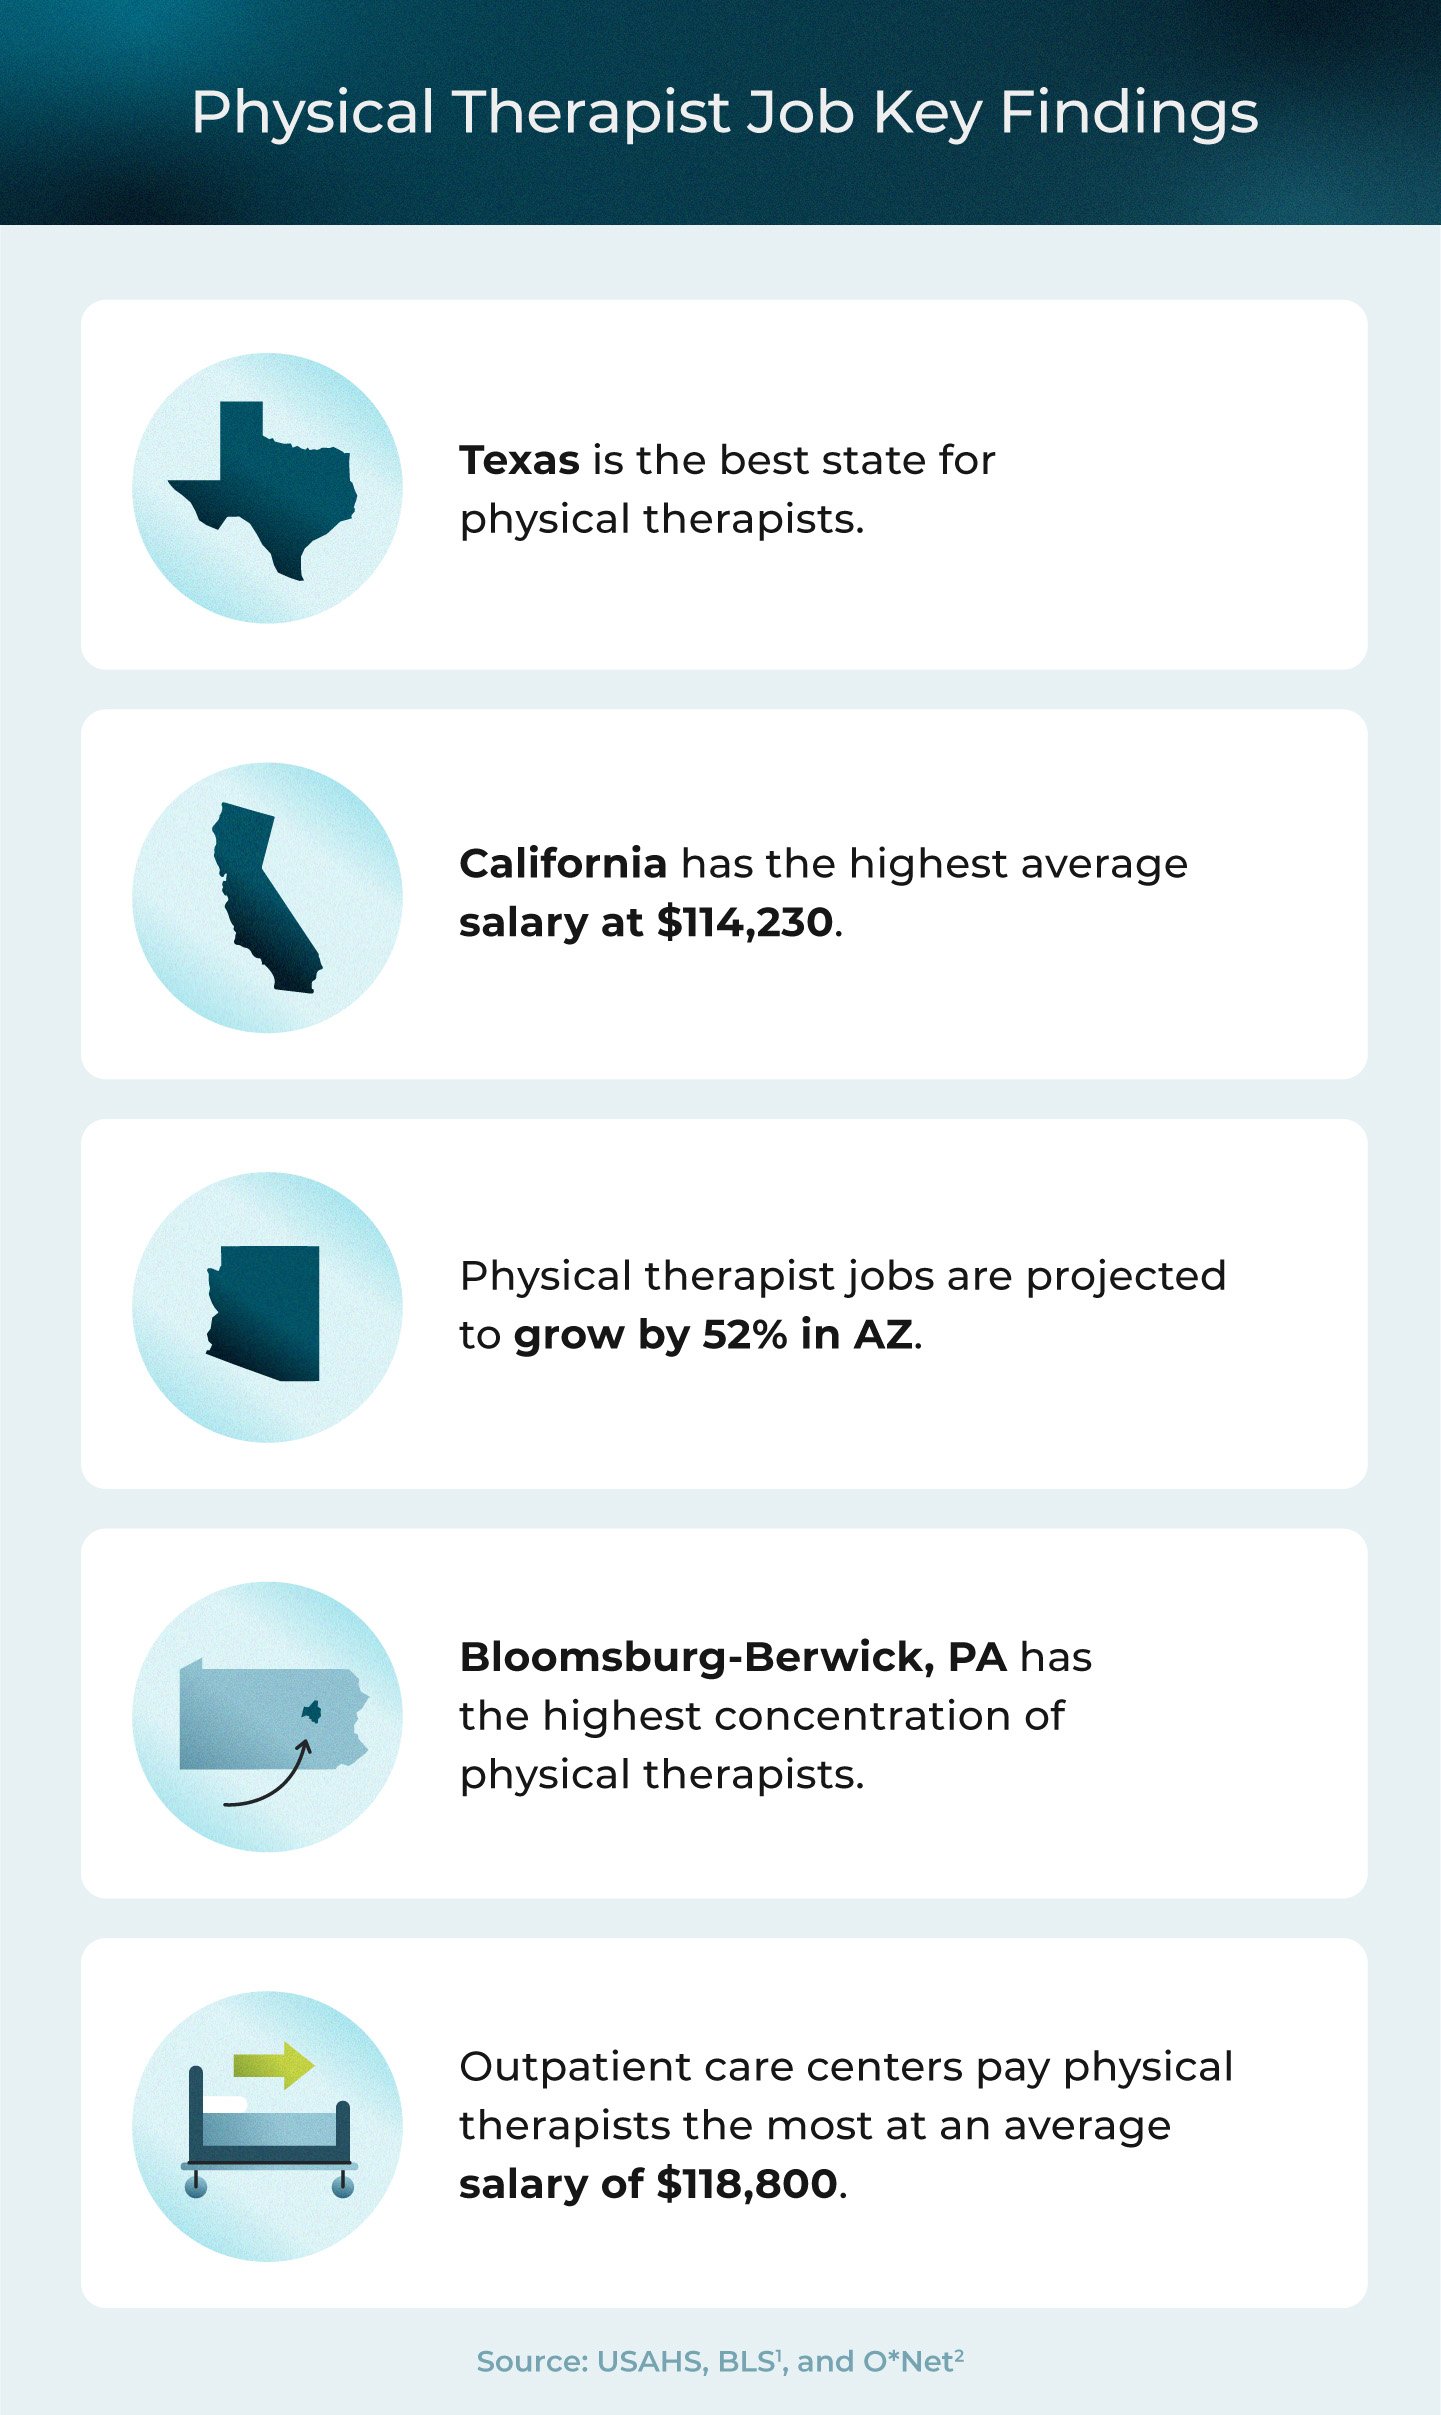
Salary is important, but it’s only one factor in identifying the best states for physical therapists. When looking at multiple data points, here are some key findings:
- Based on our methodology, Texas is the best state for physical therapists based on average salary, projected employment growth and the current cost of living.
- California pays physical therapists the most with an average salary of $114,230.1
- Arizona has the highest projected growth for physical therapist jobs: 52% by 2030.2
- The metropolitan area with the highest concentration of physical therapists is Bloomsburg-Berwick, PA, with 3.52 physical therapists per 1,000 jobs.1
- The highest-paying industry for physical therapists is at outpatient care centers, with an average salary of $118,800.1
Top 10 States for Physical Therapists
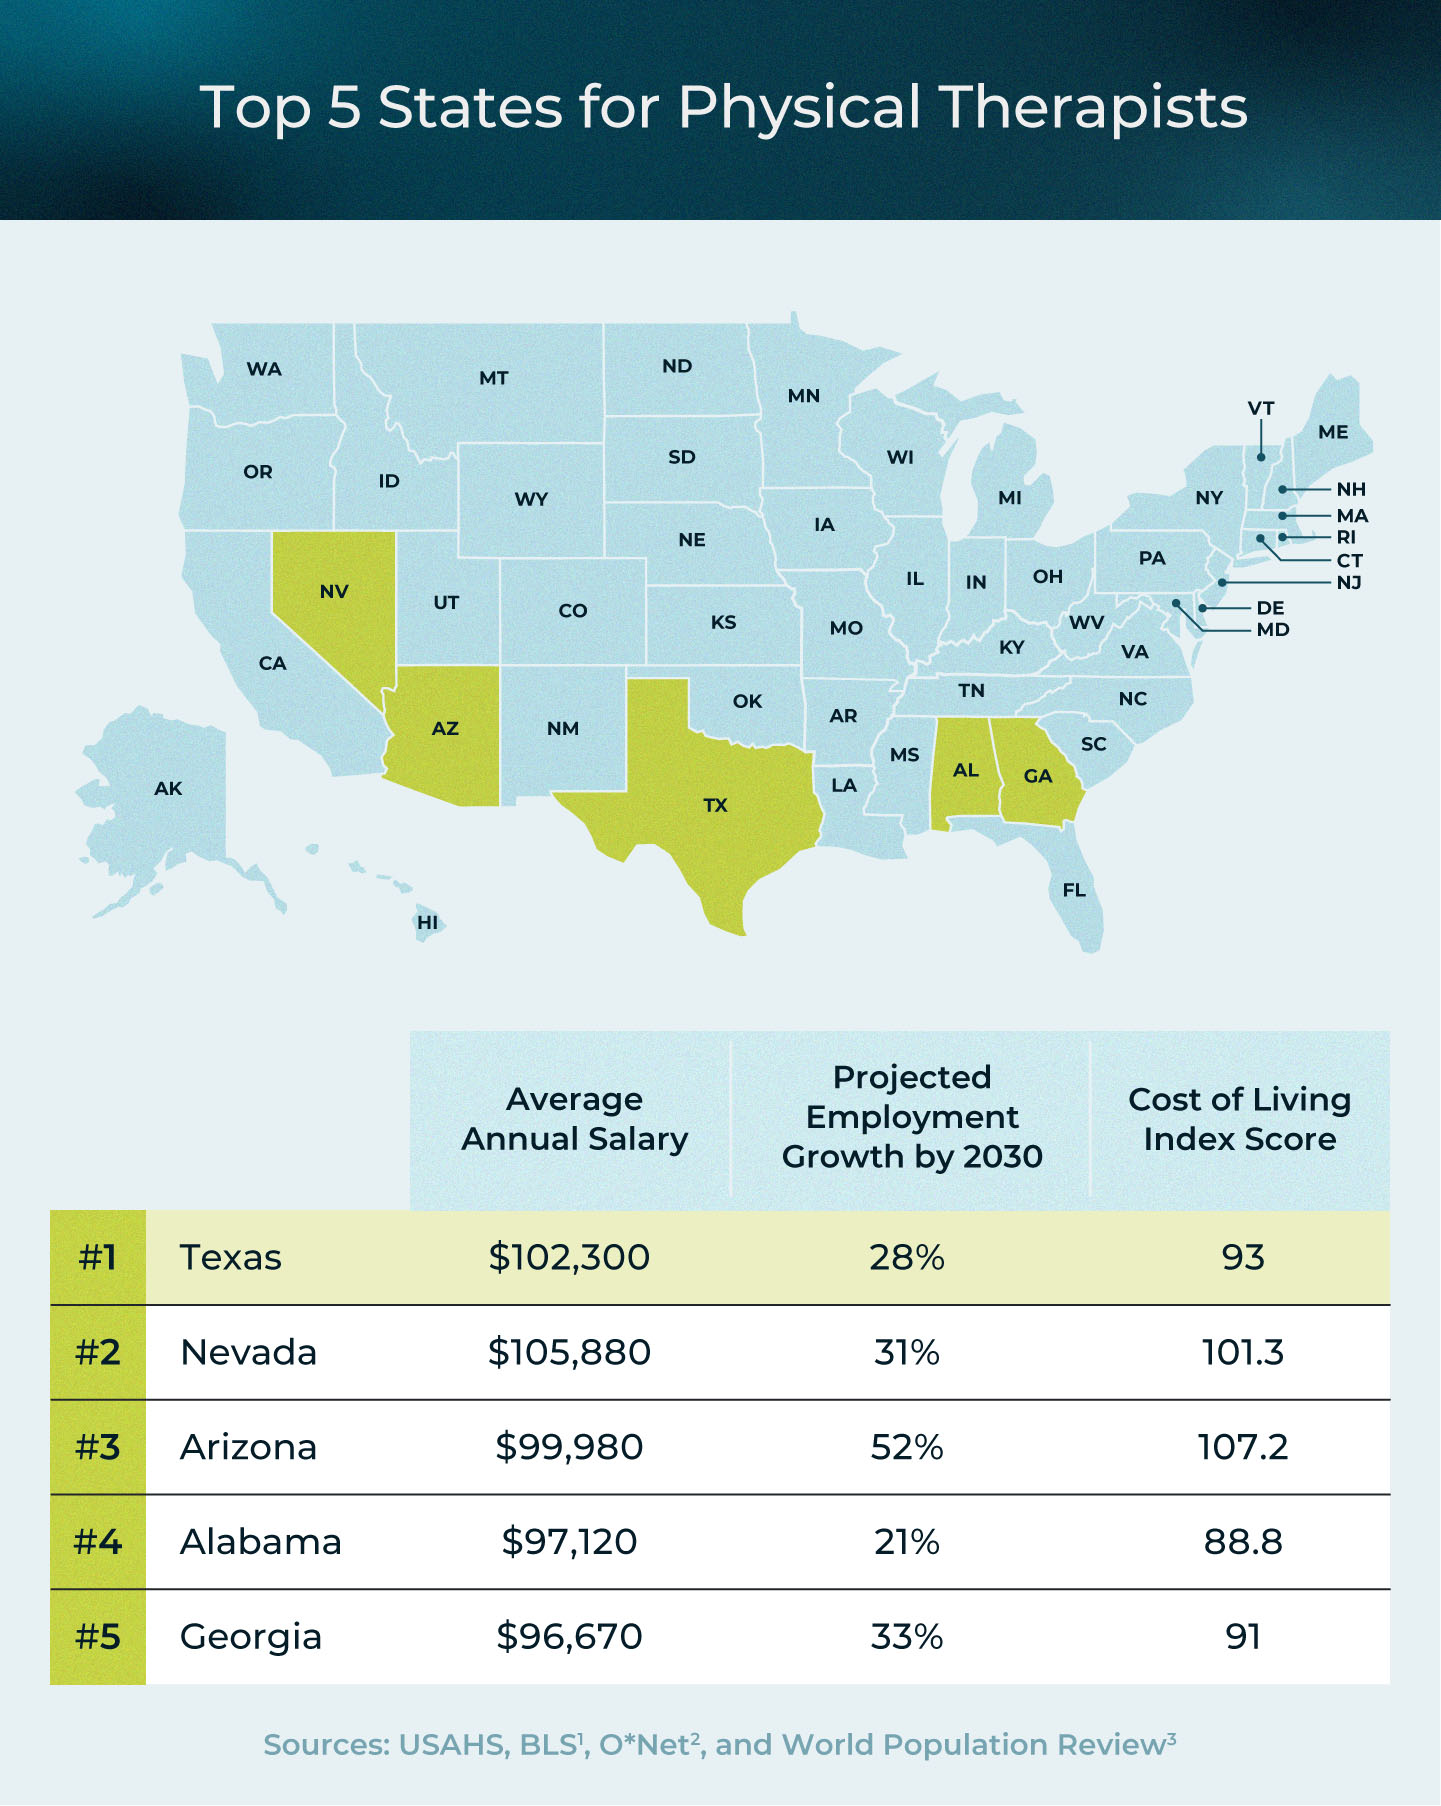
The following rankings include some states with the highest average salary for physical therapists and also consider the cost of living and expected employment growth. Of the top states, Texas is ranked in first place primarily for its projected employment growth of 28% by 2030 and average salary of $102,300. The national average salary is $97,960.1
Nevada is the second state on the list due to a high average salary of $105,880, the highest in the top 10. The third state on the list, Arizona, has the highest projected employment growth for physical therapists at 52%2 and has an average salary of $99,980. Arizona also has one of the highest costs of living in the top 10, along with New Jersey, Nevada and Colorado.3
We use our methodology to determine the following rankings, and use highest average salary as a secondary metric.
| Ranking | State | Average Annual Salary1 | Projected Employment Growth by 20302 | Cost of Living Index Score3 |
|---|---|---|---|---|
| 1 | Texas | $102,300 | 28% | 93 |
| 2 | Nevada | $105,880 | 31% | 101.3 |
| 3 | Arizona | $99,980 | 52% | 107.2 |
| 4 | Alabama | $97,120 | 21% | 88.8 |
| 5 | Georgia | $96,670 | 33% | 91 |
| 6 | Mississippi | $96,520 | 23% | 85.3 |
| 7 | Colorado | $96,170 | 37% | 105.5 |
| 8 | West Virginia | $93,000 | 35% | 90.3 |
| 9 | New Jersey | $105,430 | 24% | 114.1 |
| 10 | Pennsylvania | $97,490 | 20% | 99 |
The 5 Worst States for Physical Therapists
It’s also helpful to know the worst states for physical therapists. The worst states have a combination of low average salaries, high costs of living and a low projection for employment growth. The worst state on the list is Maine, which has an average annual salary of $86,600 and is in the top 20 for highest cost of living.
| Ranking | State | Average Annual Salary1 | Projected Employment Growth by 20302 | Cost of Living Index Score3 |
|---|---|---|---|---|
| 1 | Maine | $86,600 | 9% | 111.5 |
| 2 | Montana | $85,530 | 16% | 103.7 |
| 3 | Maryland | $96,250 | 18% | 119.5 |
| 4 | Minnesota | $89,130 | 14% | 94.1 |
| 5 | New Hampshire | $91,230 | 20% | 115 |
Average Physical Therapist Salary by State
If you’re looking for the highest-paying physical therapy jobs, it’s helpful to look at the salaries by state. One of the best metrics you can look at is the mean annual wage, which is the average.4 The state with the highest mean annual salary is California, at $114,230, with Nevada and New Jersey coming in second and third at $105,880 and $105,430, respectively.1
| State | Annual Mean Salary1 |
|---|---|
| California | $114,230 |
| Nevada | $105,880 |
| New Jersey | $105,430 |
| Alaska | $104,470 |
| Connecticut | $103,920 |
| New York | $103,580 |
| Texas | $102,300 |
| Washington | $101,130 |
| Hawaii | $100,130 |
| Arizona | $99,980 |
| Illinois | $99,420 |
| Pennsylvania | $97,490 |
| Alabama | $97,12 |
| Virginia | $96,900 |
| Washington D.C. | $96,760 |
| Georgia | $96,670 |
| Mississippi | $96,520 |
| Delaware | $96,460 |
| Maryland | $96,250 |
| Colorado | $96,170 |
| Oregon | $96,010 |
| Ohio | $95,870 |
| Louisiana | $95,820 |
| Massachusetts | $95,780 |
| Rhode Island | $94,620 |
| Arkansas | $93,160 |
| Wisconsin | $93,010 |
| West Virginia | $93,000 |
| Indiana | $92,790 |
| North Carolina | $92,200 |
| New Mexico | $92,050 |
| Nebraska | $91,990 |
| Kansas | $91,930 |
| Florida | $91,730 |
| Tennessee | $91,630 |
| Utah | $91,570 |
| New Hampshire | $91,230 |
| Oklahoma | $91,100 |
| Wyoming | $90,910 |
| Missouri | $89,790 |
| Michigan | $89,570 |
| Minnesota | $89,130 |
| Idaho | $88,750 |
| Vermont | $88,310 |
| South Carolina | $88,170 |
| Iowa | $88,120 |
| South Dakota | $88,010 |
| Maine | $86,600 |
| Kentucky | $86,220 |
| Montana | $85,530 |
| North Dakota | $83,060 |
Projected Job Growth for Physical Therapists by State
Before choosing which state is best to pursue a job, it’s beneficial to understand the job market for physical therapists in each state. To find this information, O*Net puts together projected job growth for specific industries so you can assess how much the job market for physical therapists may grow by 2030.2 Arizona expects to see a 52% growth by 2030, and states like Colorado, Washington and West Virginia have an expected job growth of over 35% in the coming years.2
| State | Projected Employment Growth2 |
|---|---|
| Arizona | 52% |
| Colorado | 37% |
| Washington | 35% |
| West Virginia | 35% |
| Georgia | 33% |
| Nevada | 31% |
| Utah | 31% |
| New York | 28% |
| Texas | 28% |
| Iowa | 27% |
| Hawaii | 26% |
| Wyoming | 26% |
| Delaware | 25% |
| Florida | 25% |
| Oklahoma | 25% |
| Idaho | 24% |
| New Jersey | 24% |
| New Mexico | 24% |
| North Dakota | 24% |
| Oregon | 24% |
| South Carolina | 24% |
| Arkansas | 23% |
| Massachusetts | 23% |
| Mississippi | 23% |
| Vermont | 23% |
| Nebraska | 22% |
| Alabama | 21% |
| Kentucky | 21% |
| North Carolina | 21% |
| Indiana | 20% |
| New Hampshire | 20% |
| Pennsylvania | 20% |
| Washington D.C. | 20% |
| California | 19% |
| Michigan | 19% |
| South Dakota | 19% |
| Virginia | 19% |
| Maryland | 18% |
| Tennessee | 18% |
| Missouri | 17% |
| Montana | 16% |
| Rhode Island | 16% |
| Alaska | 15% |
| Kansas | 15% |
| Connecticut | 14% |
| Minnesota | 14% |
| Ohio | 14% |
| Wisconsin | 11% |
| Illinois | 10% |
| Louisiana | 10% |
| Maine | 9% |
Top 5 States with the Highest Employment Levels
Projected growth is good information, but you also want to know where physical therapists work. A state with fewer physical therapists and high projected growth may indicate a good state for work. However, if the job market is oversaturated with little projected growth, perhaps consider another state.
The following data comes from the BLS:
| State | Number of Employed Physical Therapists | Employment Per Thousand Jobs |
|---|---|---|
| California | 24,100 | 1.37 |
| Texas | 16,280 | 1.25 |
| New York | 15,300 | 1.68 |
| Florida | 14,970 | 1.63 |
| Pennsylvania | 11,670 | 2.01 |
Top 5 Cities with the Highest Concentration of Employment
The following information from the BLS outlines the cities with the highest concentration of physical therapists in different cities. A high concentration comes from looking at the jobs in the area and how many are physical therapists. Cities with a high concentration of physical therapists may indicate demand, so it may be helpful to see if these cities are in states with high projected job growth.
| Metropolitan Area | Number of Employed Physical Therapists | Employment Per Thousand Jobs |
|---|---|---|
| Bloomsburg-Berwick, PA | 140 | 3.52 |
| Homosassa Springs, FL | 110 | 3.35 |
| Las Cruces, NM | 240 | 3.29 |
| Dover-Durham, NH-ME | 160 | 3.16 |
| Missoula, MT | 160 | 3.14 |
Top-Paying Industries for Physical Therapists
There are a range of industries for physical therapists, and the characteristics of a good physical therapist are beneficial for each of them. Each pays a different salary, and this list shows which pay the most on average across the country. The industry that pays the most is outpatient care centers, but you can also make a decent wage in an educational role for physical therapists.1
| Industry | Annual Mean Salary1 |
|---|---|
| Outpatient Care Centers | $118,800 |
| Home Health Care Services | $113,970 |
| Educational Support Services | $110,390 |
| Individual and Family Services | $108,100 |
| Nursing Care Facilities (Skilled Nursing Facilities) | $103,590 |

What Physical Therapists Treat
What you treat as a physical therapist may vary, but regardless of which state you live in, here are some of the common conditions PTs treat5:
- Sports-related injuries
- Skin conditions and injuries like burns
- Cardiopulmonary conditions
- Hand conditions like carpal tunnel syndrome
- Musculoskeletal dysfunction
Begin Your Physical Therapy Education Today
If you’re looking for a career in physical therapy, start with a quality education. USAHS has over 40 years of experience as a physical therapy school and a large network of alumni. When you attend USAHS, you can choose from a variety physical therapy specialties, and our programs last between 2.7 and four years. We have Residential and Flex Doctor of Physical Therapy (DPT) programs that incorporate online and in-person learning to fit your lifestyle. To learn more about our program, request additional information today.
Methodology
Our ranking system for the best states for physical therapists to work is based on three primary criteria:
- Average annual salary
- Projected employment growth for physical therapists by 2030
- Cost of living index score
Each of the criteria was graded on a five-point scale and given a higher score when the data was most beneficial for physical therapists in that state. States with the highest salaries, largest projected employment growth and lowest cost of living index scores were given the highest ratings. For example, states paying an average of $100,000 or more per year received five points for the salary category. In the event of ties in the top 10, the highest average salaries were used as the primary determining factor.
Sources:
- U.S. Bureau of Labor Statistics, “Occupational Employment and Wage Statistics,” U.S. Bureau of Labor Statistics, last modified May 2022, https://www.bls.gov/oes/current/oes291123.htm.
- O*NET OnLine, “29-1123.00 – Physical Therapists,” O*NET OnLine, https://www.onetonline.org/link/localtrends/29-1123.00?st=.Select a state using the drop-down menu at the top of the page.
- World Population Review, “Cost of Living Index by State 2023,” World Population Review, last modified 2023, https://worldpopulationreview.com/state-rankings/cost-of-living-index-by-state.
- Diffen, “Mean vs. Median,” Diffen, https://www.diffen.com/difference/Mean_vs_Median.
- Lori Smith, MSN, BSN, WHNP-BC and Ruth Eagle, “How Does Physical Therapy Help?” Medical News Today, last modified April 2023, https://www.medicalnewstoday.com/articles/160645#common-conditions.